

El AbbVie está en dirección up
El AbbVie ha experimentado un excepcional movimiento ascendente de un 8,45% de 107,75 a 116,53 en 16 días.
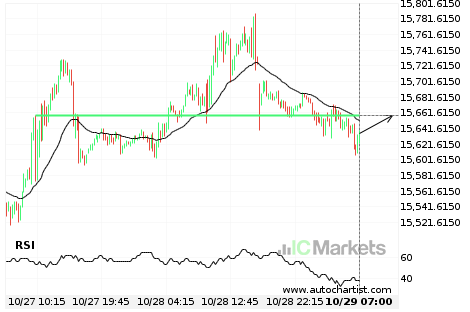
Se espera un impulso final del US Tech 100 Index
El US Tech 100 Index avanza hacia 15657.5000 y podría alcanzar este punto en las próximas 10 horas. Ha probado esta línea previamente en numerosas ocasiones, y esta vez no tiene porqué ser diferente a lo ocurrido en el pasado, terminando con una recuperación en lugar de en una rotura. Si la rotura no ocurre, […]
¿Qué está ocurriendo con el US Wall Street 30 Index?
Aquellos de ustedes que sean seguidores de tendencia probablemente estarán observando ansiosamente al US Wall Street 30 Index para comprobar si el último movimiento de un 4,17% continúa. Si no lo hace, las personas fieles al método de reversió de la media estarán encantadas de ganar con este excepcional movimiento en 27 días.
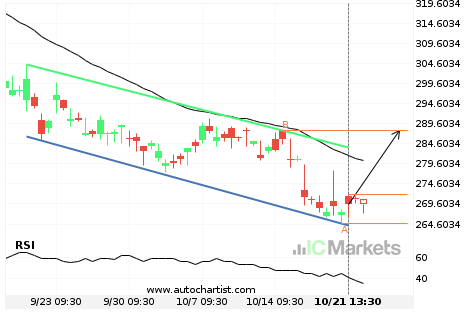
Se espera un gran movimiento del US Small Cap 2000 Index
El US Small Cap 2000 Index ha atravesado una línea de soporte de un Cuña ascendente y sugiere un movimiento posible a 2279.0257 dentro de las próximas 3 días. Ya ha probado esta línea en el pasado, por lo que deberíamos esperar la confirmación de esta irrupción antes de entrar en acción. Si dicha ruptura […]
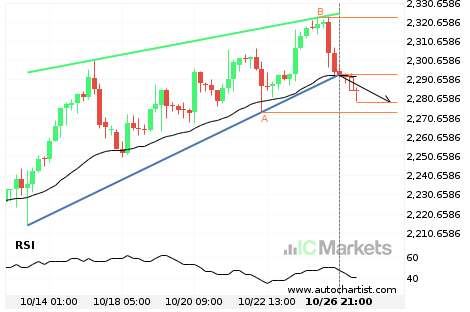
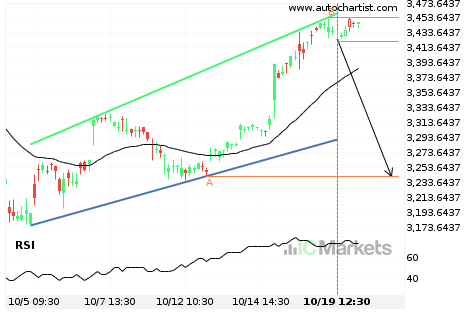
US SPX 500 Index – ha irrumpido la línea de soporte
El US SPX 500 Index ha atravesado la línea de soporte de un patrón de gráfico técnico con un Cuña ascendente. Como le hemos visto retroceder desde esta posición en el pasado, deberíamos esperar la confirmación de la ruptura antes de operar. Ha llegado a esta línea dos veces en los últimos 21 horas y […]
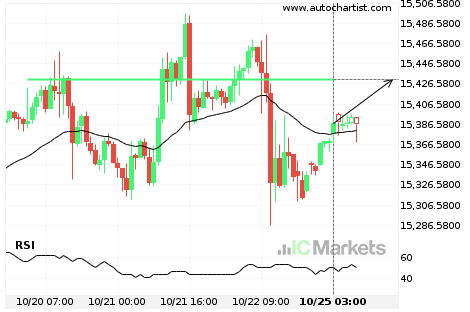
Se espera un impulso final del US Tech 100 Index
El US Tech 100 Index avanza hacia 15430.5996 y podría alcanzar este punto en las próximas 12 horas. Ha probado esta línea previamente en numerosas ocasiones, y esta vez no tiene porqué ser diferente a lo ocurrido en el pasado, terminando con una recuperación en lugar de en una rotura. Si la rotura no ocurre, […]
El Biogen Idec Inc se aproxima a la resistencia de un Canal bajista
El Biogen Idec Inc se está acercando a la línea de resistencia de un Canal bajista. Ha llegado a esta línea en numerosas ocasiones durante los últimos 31 días. Si vuelve a probarla de nuevo, debería hacerlo en las próximas 3 días.
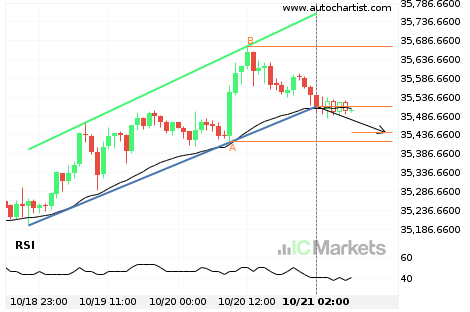
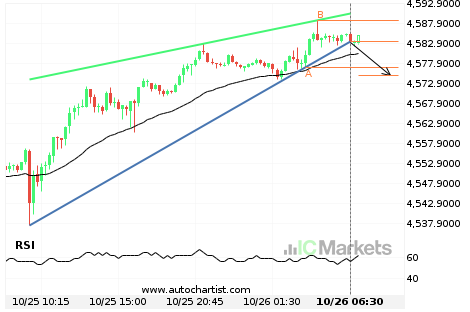
El comienzo de una tendencia bajista para el US Wall Street 30 Index
El US Wall Street 30 Index ha atravesado una línea de soporte de un patrón de gráfico que corresponde a un Canal alcista. Si esta irrupción se mantiene, podríamos ver el precio del US Wall Street 30 Index probando el nivel de 35443.3308 dentro de las próximas 11 horas. Pero no se apresure si desea […]
¿Deberíamos esperar una ruptura o una recuperación del Amazon.Com Inc.?
El movimiento del Amazon.Com Inc. hacia la línea de soporte de un Canal alcista es otra prueba más de la línea que ha alcanzado en numerosas ocasiones durante el pasado. Esperamos que esta prueba ocurra en las próximas 20 horas, pero no sabemos si dará como resultado una irrupción a través de esta línea o […]
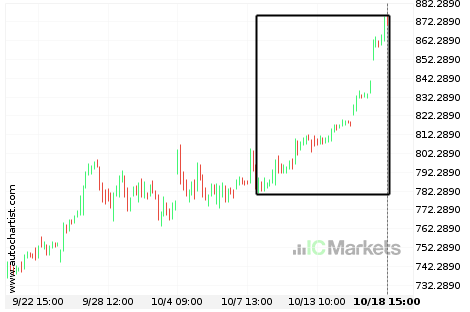
El Tesla Inc. está en dirección up
El Tesla Inc. ha experimentado un excepcional movimiento ascendente de un 11,33% de 783,4 a 872,535 en 11 días.